HOME > DATA VISUALIZATION
THE PURPOSE OF
VISUALIZATION IS INSIGHTS
The amount of information that humans gain through vision is far beyond that of other organs. Data visualization is the use of human natural skills to enhance data processing and organization efficiency. Visualization can help us deal with more complex information and enhance memory.
What it is
Data visualization is the presentation of quantitative information in a graphical form. In other words, data visualizations turn large and small datasets into visuals that are easier for the human brain to understand and process..
Why It Matters
The amount of information that humans gain through vision is far beyond that of other organs. Data visualization is the use of human natural skills to enhance data processing and organisation efficiency.
Crafting Better DVs
Good data visualizations are created when communication, data science, and design collide. Data visualizations done right offer key insights into complicated datasets in ways that are meaningful and intuitive.
Charts Used
D3
D3.js is a JavaScript library based on data manipulation documentation. D3 combines powerful visualization components with data-driven DOM manipulation methods.
HighCharts
HighCharts is a chart library written in pure JavaScript that makes it easy and convenient for users to add interactive charts to web applications
ECharts
Echarts is an enterprise-level chart tool from the data visualization team of Baidu. It is a pure Javascript chart library that runs smoothly on PCs and mobile devices.
Data Visualization Dashboards
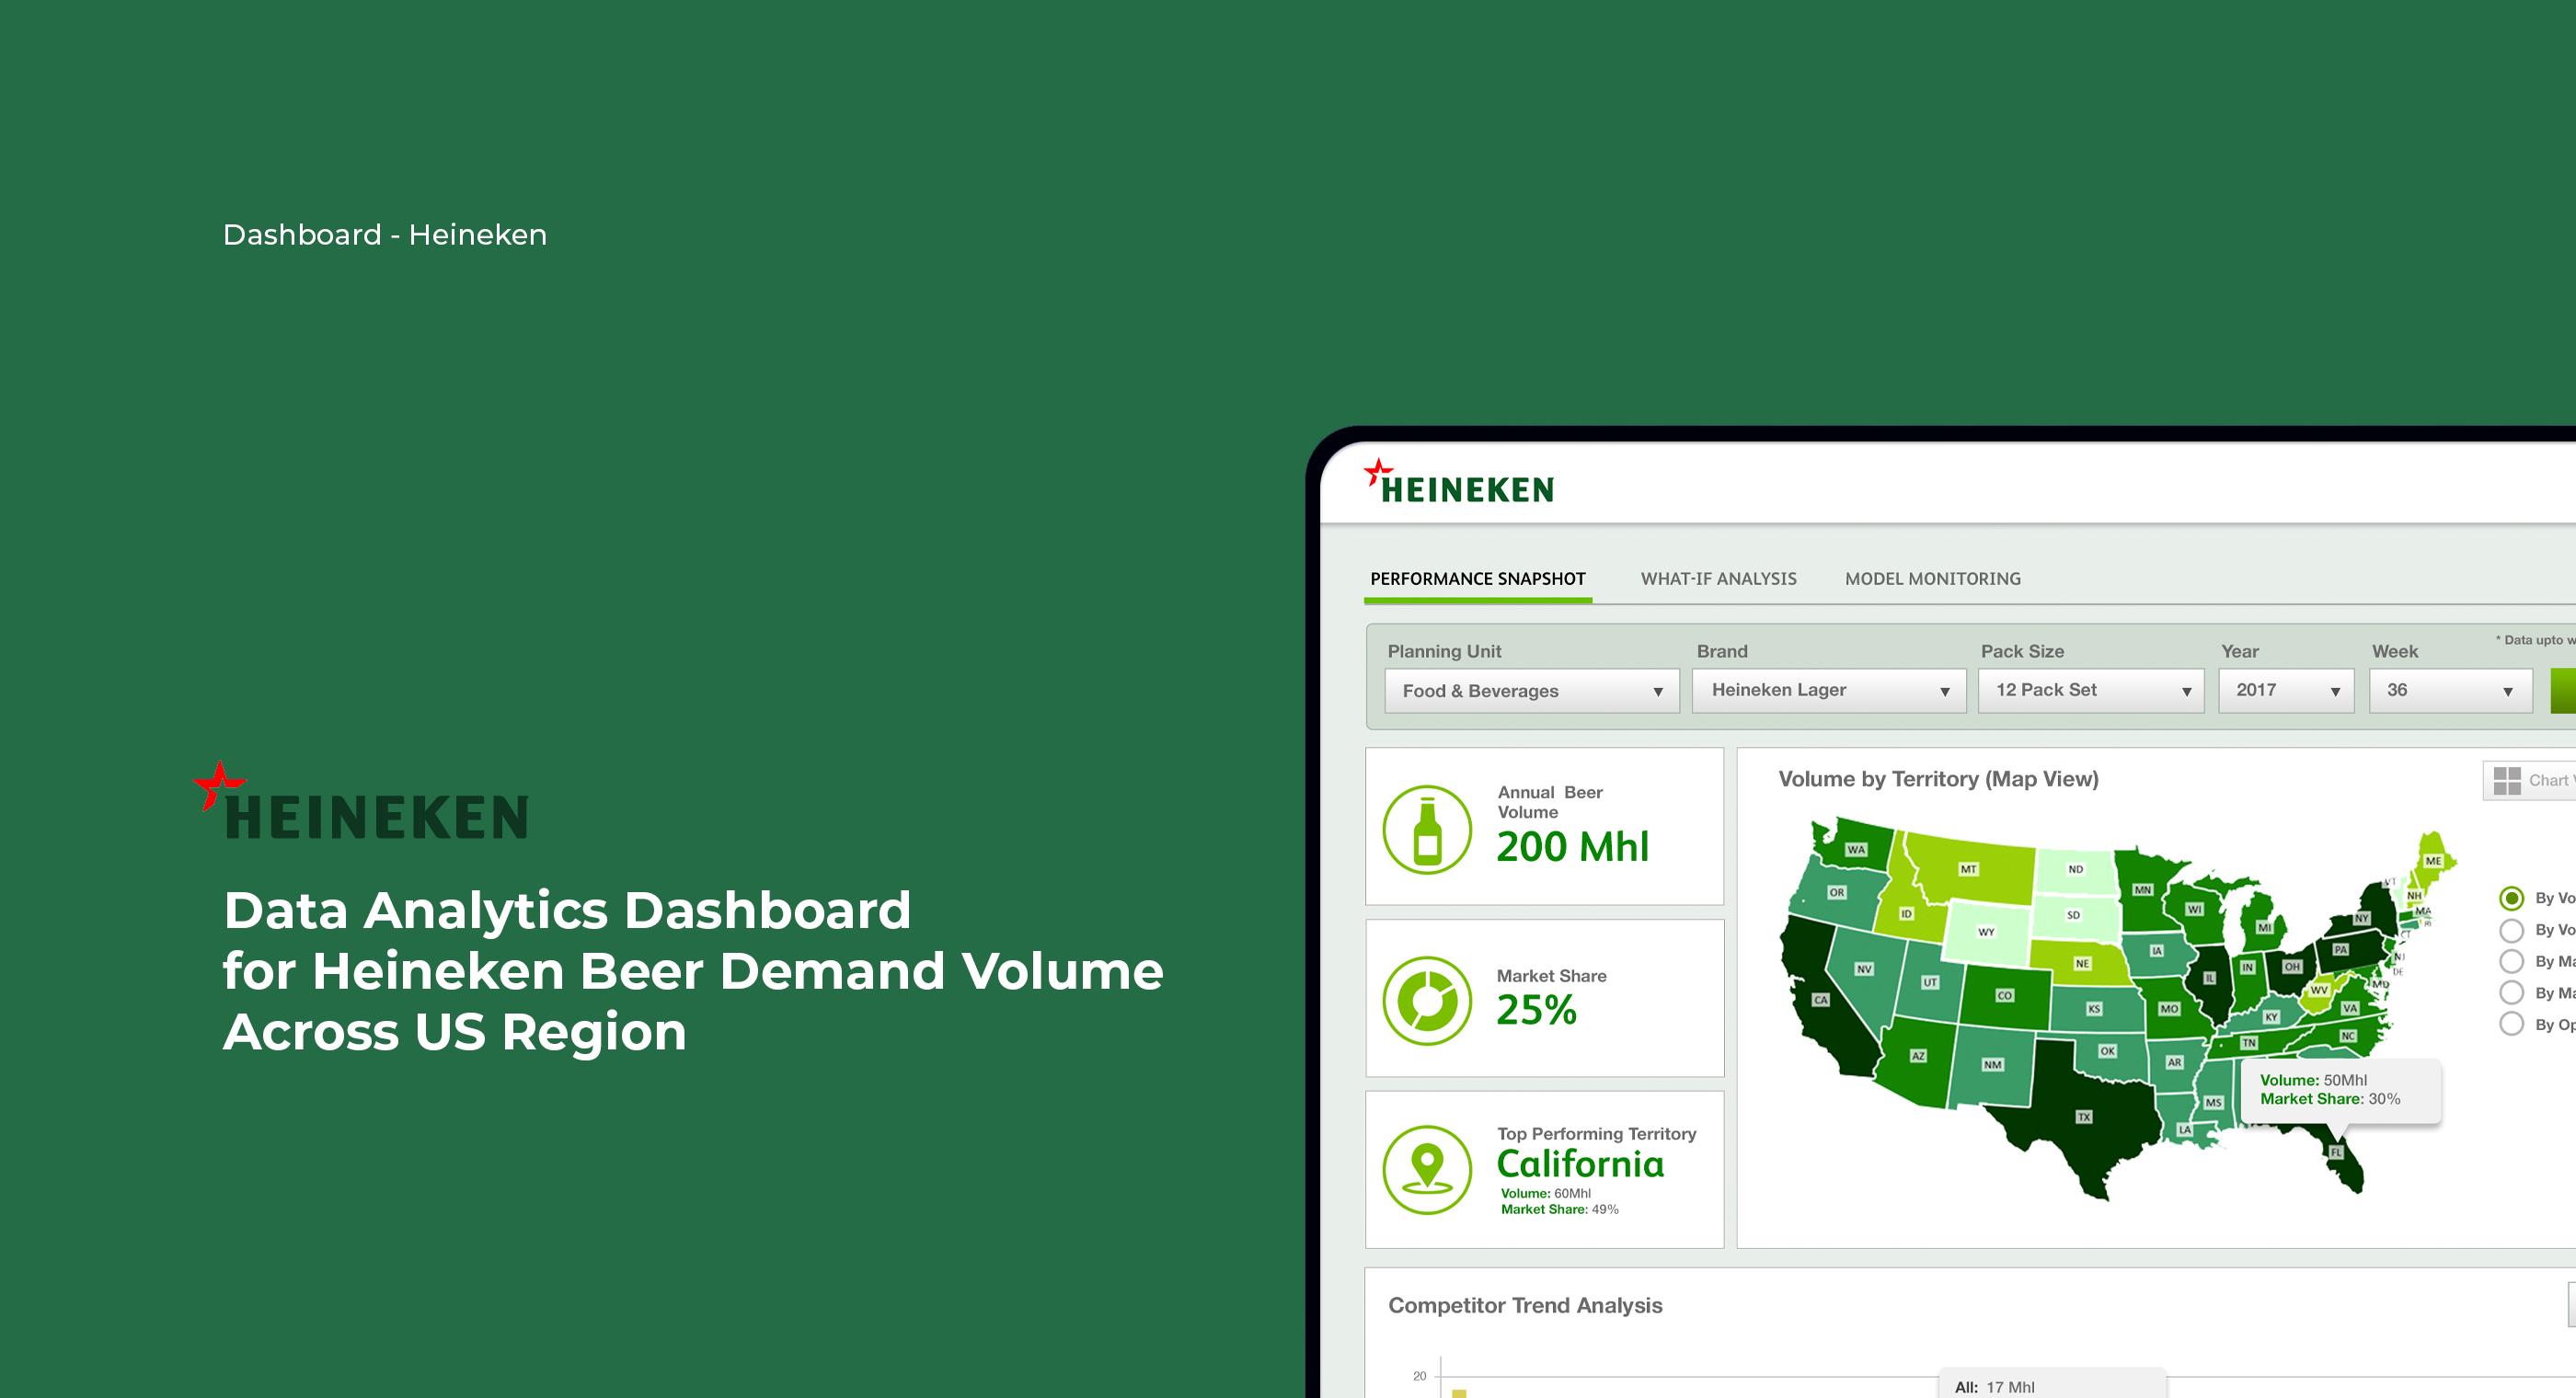
Heineken Demand Volume Dashboard
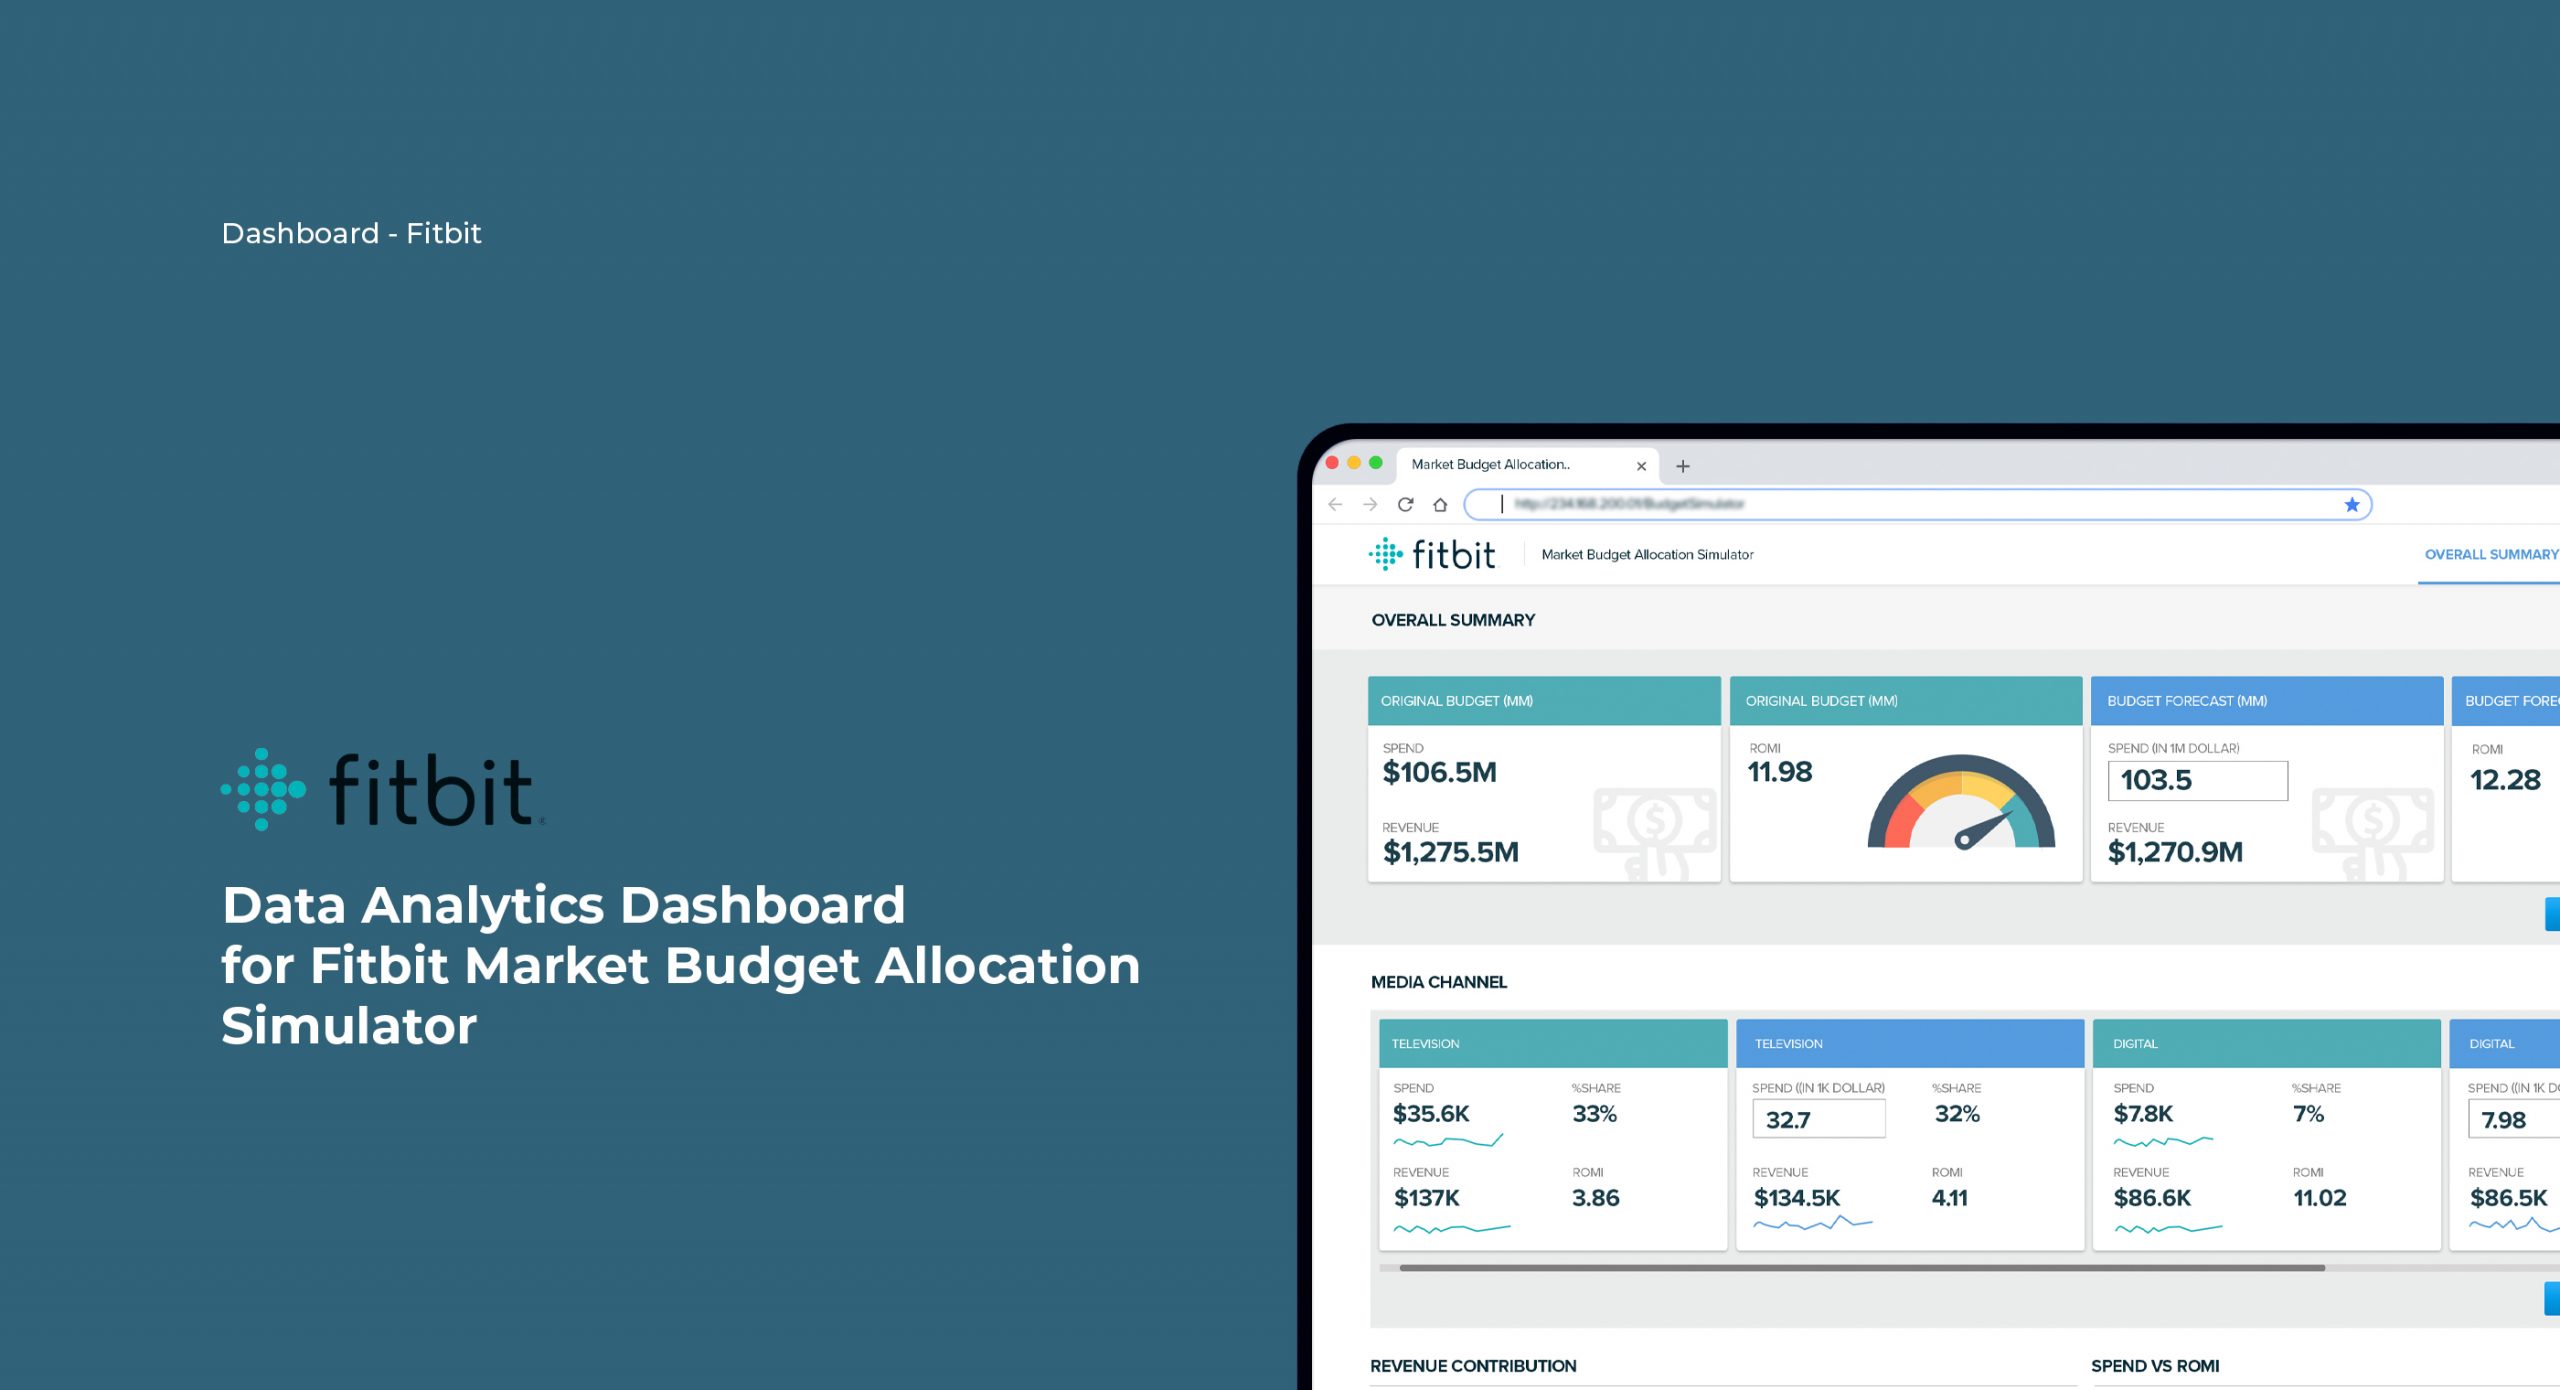
Fitbit Market Budget Allocation Dashboard